Testing Method
General Testing Setup
Introduction
To test and determine the heat load that our system can manage, we must be able to measure the temperature of the outgoing fluids. In our case, the mediums through which we will be transferring energy are water and air. The water will be carrying the heat energy from the air via a heat exchanger. This water will then be taken back to the evaporative cooler for exhausting the contained energy. By measuring the temperature of the outgoing air with regards to the input air temperature, we can get a heat flow rate, allowing us to understand and optimize our outcome.
We are required to have a minimum drop of 15°F over the heat exchanger in the air handling unit. There is also a need for a minimum of 100 CFM to both the air handler and to the evaporative cooler. We will be interested in the inlet vs outlet temperature over the heat exchanger in this air handling unit. This will give us a tangible heat load that is being extracted by the medium in the air handling unit.
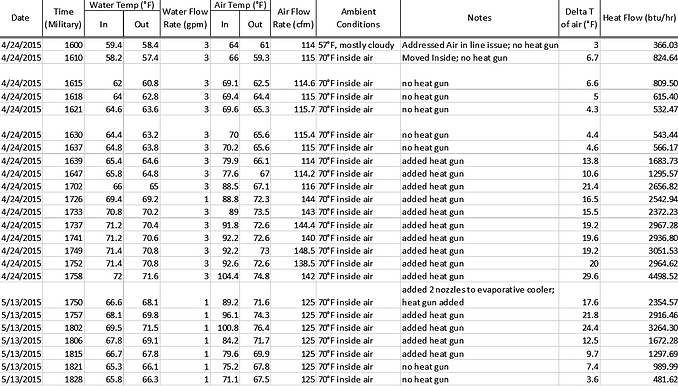
The data will be taken by hand every 5-10 minutes during operation to give a time-lapse figure of how the system is performing. The measured data will include date, time, water temperature in and out of the air handling unit, the hydronic flow rate, the air temperature in and out of the air handling unit as well as this flow rate, and also notes on ambient conditions and other points of interest.
Method/Approach
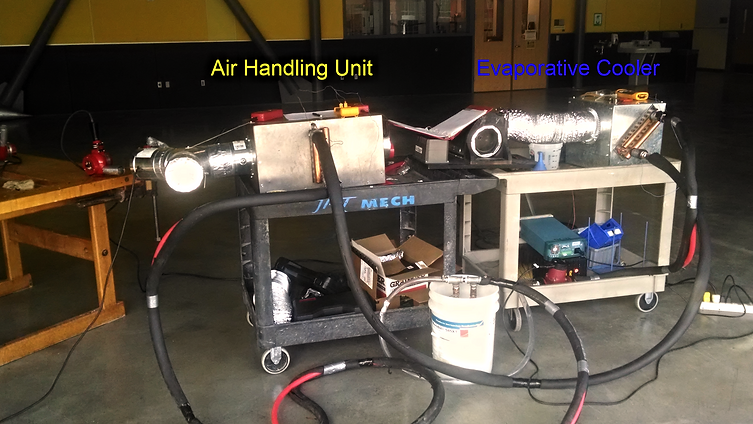
In testing this cooling system, we will be in an enclosed space (inside, Fluke Laboratory, Hogue Building) with a regulated HVAC system. Our system will have power supply to the fan motor and controller, which we will be varying for our optimization. We will also need multimeters (supplied by Roger Beardsley) with thermocouples to measure the temperatures on the inlet and outlet ports for the air and water going into the air handling unit. We will be using anemometers to measure the leaving air flow through the unit. The hydronic flow rate will be monitored and maintained through the digital readout on the pump itself, found to be at a constant 3 GPM with few fluctuations to 1 GPM.
There will be a heat gun pointed into the inlet of the airstream, to simulate warm environmental air, provided by the department. There is a thermocouple in the midst of this airstream to accurately measure the temperature of the air as it is entering the air handling unit. This air is then pushed over the cooled coils of the heat exchanger, where it is cooled. We are measuring the entering and exiting water temperature to obtain a value for the drop in temperature over these coils. The air then exits the unit where another thermocouple is placed to measure the exiting air temperature. As for the water circulation line, we have replicated a closed-loop system using a hose fitting attached to a valve to be used for priming the line. There is also an air escape valve located at this point to take the air out of the system to more closely replicate a closed-loop system setup.
The data is collected by hand through reading the instrumentation and making observations. Data is collected at 5-10 minute intervals as the system is running. These points will then be plotted into Microsoft Excel to assist in determining a convergence point at which our system will have maximum effectiveness. We have tried to keep air flow through the air handling unit a constant to try to vary the other factors, yet there are fluctuations in the actual air flow. This is being mitigated by taking an average CFM reading from the anemometer at the time of the data point collection. There are also thermal losses through the water line, which have been mitigated through the optimization of the system via insulation. The air handling unit itself may have thermal losses through the sheet metal, although such effects have been deemed trivial.
The data taken by hand will then be entered into Microsoft Excel and analyzed. We will use the flow rate of air through the Air Handling Unit as well as the temperature difference obtained to calculate a heat flow rate that the device is removing from the air. This will be graphed to show the effects of heat flow verses both the air flow rate and the temperature drop. Data will be included that shows the device operating at normal room-temperature conditions as well as the device operating with a substantial heat load on it through the use of a heat gun. This will give us accurate data that pertains to the capability of our system in a real-world scenario in which outside air is being cooled as it is ducted into a room.
Test Procedure
We have tested vigorously on three separate dates, 4/24/2015, 5/13/2015 and 5/14/2015. In recording testing times alone, we have put in close to 3 hours. This does not include troubleshooting and setup times. All tests have been performed in the Fluke Lab in Hogue Technology Building, with only two data points having been taken outside. The testing was moved inside in an attempt to more readily control the atmospheric conditions for our testing purposes.
The ducting and construction of our systems complete, we began to measure the temperature of the water entering and leaving both the air handling unit and the evaporative cooler. The optimization consisted of testing the inlet and outlet water temperatures between the evaporative cooler and the air handling unit with and without insulation on the lines. From this, we were able to determine that insulating the lines provided better heat flow retention in the lines.
For testing purposes, we set up independent air flow sources to assist in the control of fan speed and heat removal. The air handling unit had a heat gun pointed at the entrance with the fan on, leaving our control air flow to be 140 CFM as a base point of testing. We also took data at higher and lower air flow rates to get a broad range of usable data at different conditions. We then began the cooling process. Jeremy will be monitoring the hydronic flow rate over the coils, which is controlled via a digital readout at the pump, and we measured the input and output temperature and relative humidity of the air. The monitoring on the air handling unit had an anemometer on the output of the system to measure the air flow. There were thermocouples placed on the inlet and outlet points of both the water source and air source to obtain accurate data.
There were really no adverse safety precautions that needed to be taken, but we did however encounter issues with air getting into the lines for our plumbing. This was mitigated by the addition of an inlet valve to prime the system and an air-relief valve to get the majority of the air out of the line. After this was completed we were able to get all of our data when we tested.
Deliverables
·Main Testing
Raw Data
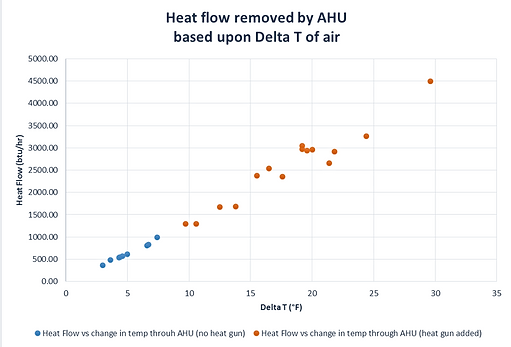
After analyzing the data obtained, we found that there was an overall average heat load of 1841.9 btuh (figure 13) that was being removed from the room. If we look at the points in which the system more closely resembles one with a larger load to be taken out (i.e. hot outside air being passed through the air handling unit and to a room), we see that we are able to more effectively remove the heat load from the air (figure 11). This makes sense, as the working fluid (water) is relatively close to room temperature and will be less efficient at heat transfer as the temperature of the passing air comes near equilibrium with the working fluid in the system. When we simply look at the points where a heat gun was used, our heat load taken from the system shoots to 2565.0 btuh, a point well above our projected need. At the points where mild temperature equilibrium occurs, the heat load removed was 636.6 btuh, substantially lower overall.
Heat flow removed by AHU based upon Delta T of air
Heat flow removed by AHU based upon Air Flow Rate
As seen in the “Calculated Parameters” entry in the Analysis and Design Section, our projected heat load to be removed was 2140 btuh. We were well within these parameters when our system was met with the higher entering temperature, but the system lost its effectiveness as we approached ambient inlet temperatures. If we look at what the system would do under heavy loads, which is when it would be needed most, we can say that our ability to dispose of excess heat is more than satisfactory (2410 btuh projected vs. 2565 btuh actual). It is also notable that as seen in the previous figure, the heat flow that was able to be removed
The success criteria laid out was that a temperature drop of 20°F was to be obtained in the air handling unit, from 75°F down to 55°F. The average drop in temperature for the heat gun portion of data was 18.1°F, close to our projected temperature drop. For the system with the standard removed heat load of 636.6 btuh and working with ambient temperatures, we only saw a 5.1°F drop in temperature (figure 13). Our overall average temperature drop was 13.2°F. See following figure for additional information.
Averages of given raw data
·Optimization
We also decided to look at how adding insulation to our working fluid transportation lines would affect the overall heat loss while in transit. We conducted our testing with the insulation in place, then removed it after testing to obtain the corresponding data. Data was taken between the evaporative cooler output to the air handling unit input, and also from the air handling unit output to the evaporative cooler input.
Raw Optimization Data
Delta T b/t AHU in & EC out Delta T b/t AHU out & EC in
As seen in the above figures, the temperature differences recorded were higher in both transportation lines with the insulation on. This makes sense, as the ambient temperature in both scenarios was higher than the working fluid temperature in the lines, making heat transfer more likely to occur. It is also notable that less heat transfer was occurring in both scenarios upon leaving the air handling unit/entering the evaporative cooler. This is another instance in which the temperatures in the lines are closer to the ambient temperature, leading to a smaller overall change and, thus, less heat transfer.